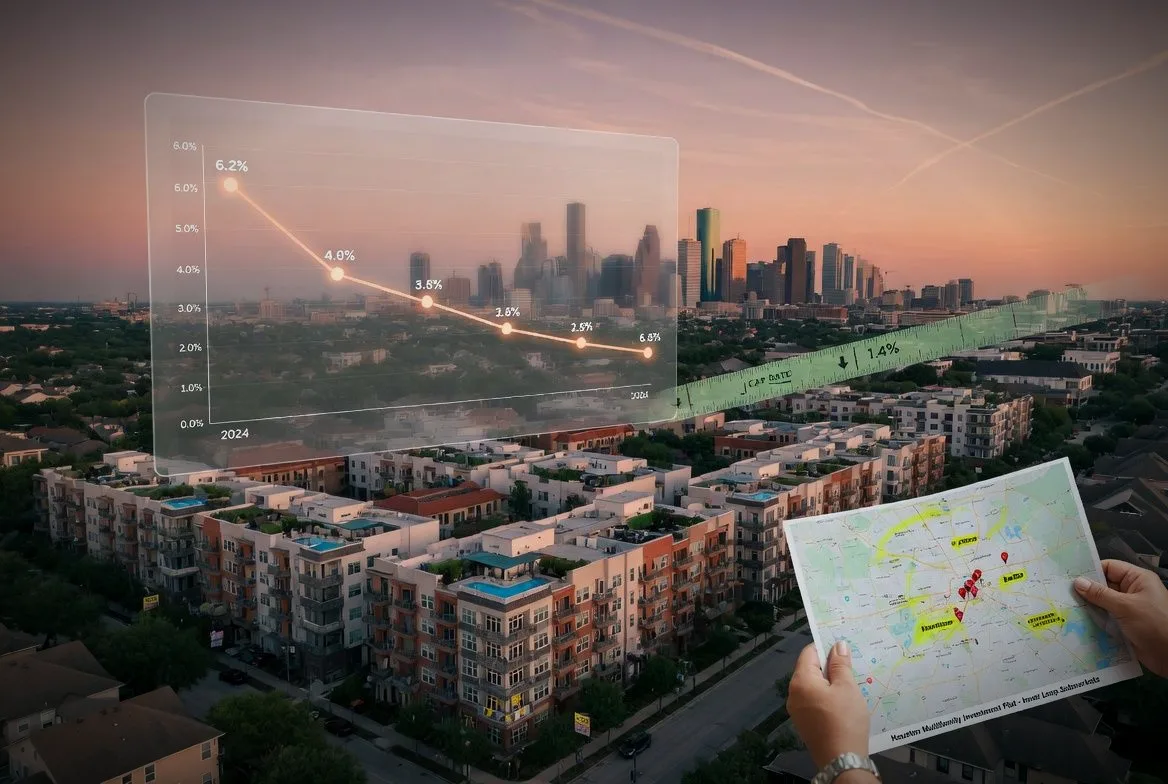
If you've been shopping for multifamily deals in Houston's Inner Loop over the past 12 months, you've probably noticed: the deals are getting more expensive. Properties that would have traded at an 8% cap in 2024 are now closing at 7% or less. This is cap rate compression in action — and understanding it is critical to making smart acquisition decisions.
What Is Cap Rate Compression?
Cap rate compression happens when property values rise faster than NOI. In formula terms:
Cap Rate = NOI / Property Value
When the denominator (value) increases but the numerator (NOI) stays flat or grows slowly, the cap rate falls. A lower cap rate means you're paying more per dollar of income — which means lower initial yield.
Example: A property generating $100K NOI that was worth $1.25M (8% cap) a year ago might now sell for $1.43M (7% cap). Same income, higher price.
Where It's Happening in Houston
Cap rate compression is not uniform across the metro. It's concentrated in submarkets where:
- Population density is increasing — More renters competing for limited units
- Institutional capital is arriving — Larger funds are moving into smaller deal sizes
- New development is constrained — Infill areas with limited vacant land
Inner Loop Compression (50–100+ bps over 18 months)
| Submarket | Cap Rate (2024) | Cap Rate (2026) | Compression |
|---|---|---|---|
| Montrose | 7.5% | 6.8% | -70 bps |
| Heights | 7.8% | 7.2% | -60 bps |
| EaDo | 7.2% | 6.5% | -70 bps |
| Midtown | 7.5% | 6.9% | -60 bps |
| Rice Military | 6.8% | 6.0% | -80 bps |
| Museum District | 6.5% | 5.8% | -70 bps |
Stable Markets (minimal compression)
| Submarket | Cap Rate (2024) | Cap Rate (2026) | Compression |
|---|---|---|---|
| Spring Branch | 8.0% | 7.5% | -50 bps |
| Westchase | 8.2% | 7.8% | -40 bps |
| Alief | 8.8% | 8.4% | -40 bps |
Still Wide (high yield, limited compression)
| Submarket | Cap Rate (2024) | Cap Rate (2026) | Compression |
|---|---|---|---|
| Greenspoint | 10.8% | 10.5% | -30 bps |
| Sharpstown | 10.0% | 9.8% | -20 bps |
| Kashmere Gardens | 10.5% | 10.2% | -30 bps |
| Sunnyside | 11.2% | 10.8% | -40 bps |
Why It Matters for Your Strategy
Cap rate compression changes the math on acquisitions in three important ways:
1. Cash-on-cash returns are lower at entry
At a 6.5% cap with 70% LTV and 6.5% interest rate, your Year 1 cash-on-cash return might be 3–5%. That's thin. In 2024, the same deal at an 8% cap might have yielded 7–9% cash-on-cash.
Implication: You need a value-add thesis to make Inner Loop deals pencil. You can't just buy and hold at today's pricing and expect strong cash flow.
2. Exit cap assumptions are riskier
If you buy at a 6.5% cap and underwrite a 6.5% exit cap in 5 years, you're assuming no cap rate expansion. If rates rise or the market softens, your exit cap might be 7.0–7.5%, which compresses your equity multiple.
Implication: Stress-test your models with exit caps 50-100 bps wider than your going-in cap. Our underwriting framework walks through exactly how to run bull, base, and bear scenarios.
3. The yield curve is steeper across submarkets
The spread between Inner Loop and outer-ring cap rates has widened from ~200 bps to ~350+ bps. This creates a strategic choice:
| Strategy | Inner Loop (6.5% cap) | Outer Ring (9.5% cap) |
|---|---|---|
| Cash flow at entry | Low | High |
| Appreciation potential | High | Moderate |
| Rent growth | 4–6%/yr | 2–3%/yr |
| Tenant quality | Higher income | Workforce |
| Management intensity | Lower | Higher |
| Value-add premium | High per unit | Lower per unit |
Practical Strategies
If You're Buying Inner Loop
- Target properties with below-market rents (value-add through renovation)
- Model conservative exit caps (going-in + 50 bps minimum)
- Focus on forced appreciation through NOI growth, not cap rate compression
- Consider shorter hold periods (3–5 years) to capture renovation upside
If You're Buying Outer Ring
- Prioritize current cash flow and DSCR
- Budget heavily for capex reserves (older buildings, deferred maintenance)
- Implement operational improvements (RUBS, expense reduction) before capex
- Plan for longer holds (5–7 years) as appreciation is slower
The Middle Ground: Gentrifying Submarkets
Submarkets like Third Ward, Near Northside, Second Ward, and Independence Heights offer a blend: current cap rates of 8-9% with rent growth trajectories closer to Inner Loop markets. These are where the compression will happen next. See our Houston submarket deep dive for detailed metrics on each of these neighborhoods.
The risk: gentrification timelines are unpredictable. You might be early by 2–3 years, so make sure the deal works at today's rents, not tomorrow's projections.
Related Reading
- Houston Submarket Deep Dive: Where to Invest in 2026 — Detailed cap rate, rent growth, and strategy data for 10 Houston neighborhoods
- How to Underwrite a Multifamily Deal in 30 Minutes — Stress-test cap rate assumptions in your acquisition analysis
- Financing Your First (or Next) Multifamily Property — How debt structure interacts with compressed cap rates to affect your returns
properlocating's acquisition model lets you stress-test cap rate scenarios across all 49 Houston properties. Try it free.